Environmental Data Bias: Case Studies and Pathways to Justice
Introduction
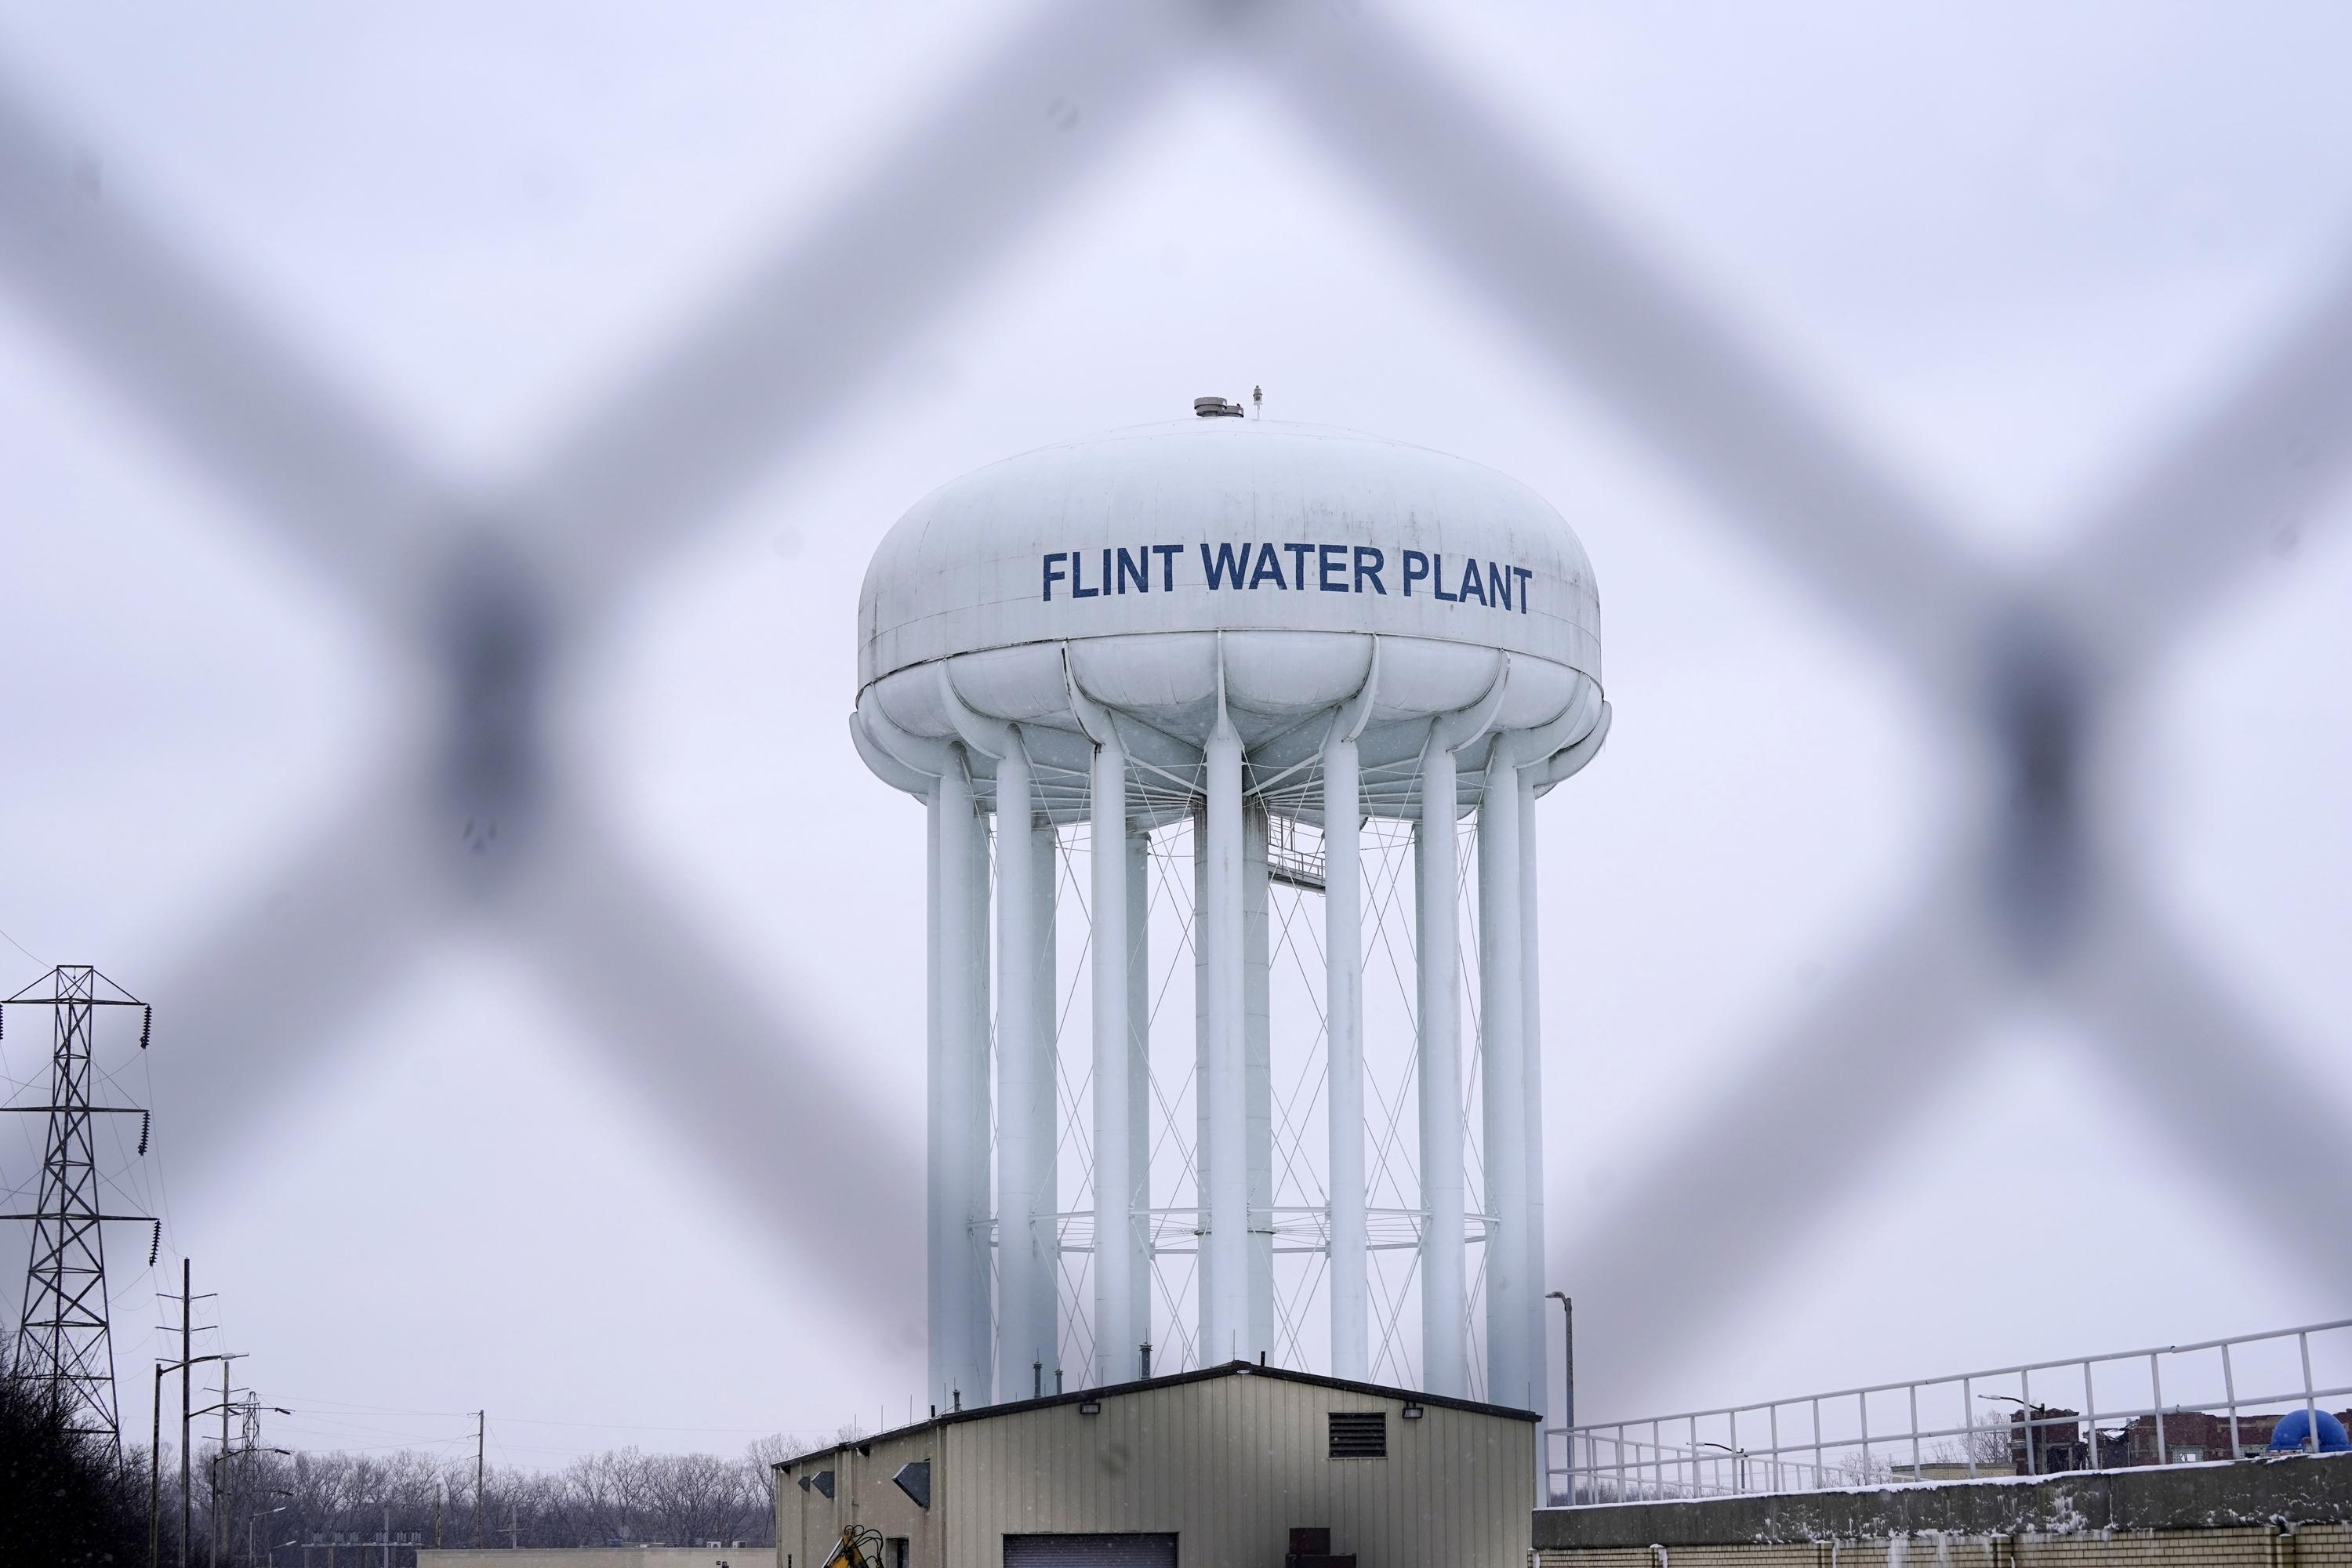
In 2014, Flint, Michigan changed its water source to the Flint River, triggering one of the most infamous environmental justice crises in the United States. Residents complained of foul smelling, discolored water, but official reports insisted the water was safe. The problem was not only the contamination itself—it was the way data were collected and reported. This case study examines how measurement bias and reporting bias in lead testing concealed the severity of contamination, delayed action, and eroded trust in public institutions. Flint is not an isolated incident. Similar forms of bias have appeared in other environmental contexts: suppression of climate policy tools (Nost et al., 2024), averaging emissions that mask acute exposures (Walker et al., 2018), deficit framing in Indigenous health statistics (Walter & Suina, 2019), and sampling gaps in biodiversity monitoring (Young et al., 2014). By situating Flint within this broader landscape, we can see how data bias is a systemic issue that undermines both science and justice.
The Case
The Data and the Problem
State agencies tested household water samples for lead contamination. Their protocols introduced systematic bias: taps were flushed before samples were taken, which lowered lead readings; unusually high results were discarded as “outliers”; and sampling was concentrated in lower risk areas rather than older homes with lead service lines. These practices produced datasets that looked statistically sound but misrepresented the true extent of contamination. Independent researchers from Virginia Tech and local pediatricians conducted their own sampling, uncovering far higher lead levels, especially in vulnerable neighborhoods. Dr. Mona Hanna Attisha’s study of children’s blood lead levels provided irrefutable evidence that official testing had failed to capture the crisis.
Identifying the Bias
The biases here were twofold: • Measurement bias: Sampling methods underestimated lead concentrations by flushing taps and avoiding high risk homes. • Reporting bias: Inconvenient results were excluded, creating a false picture of safety. Together, these practices reassured the public while masking the severity of the crisis.
The Consequences
Because of these biases, recognition of the crisis was delayed. Thousands of residents, including children, were exposed to dangerous levels of lead. The official data eroded trust in institutions, while independent data revealed the scale of contamination. The consequences were long term health impacts, community outrage, and a national reckoning with environmental justice.
Reflection
The Flint case underscores how technical decisions in data collection are never neutral. Choices about flushing taps or discarding results reflected institutional priorities rather than community realities. This mirrors what Vera et al. (2019) describe as extractive logic in environmental data practices, where data are shaped to protect institutions rather than people. It also highlights the invisibility of bias. A dataset can appear rigorous if you don’t ask what was excluded. This parallels Konno et al. (2024) on hidden biases in environmental causal inference. In Flint, the testing protocols produced results that fit official narratives but diverged from lived experience. Flint also resonates with other cases: • Suppression bias: Nost et al. (2024) showed how climate policy tools were erased from public websites. • Measurement bias: Walker et al. (2018) documented how averaging emissions masked acute exposures in Louisiana. • Deficit framing bias: Walter & Suina (2019) critiqued Indigenous health statistics that reinforced colonial narratives. • Sampling bias: Young et al. (2014) revealed biodiversity datasets privileging charismatic species. Each case demonstrates that bias is not accidental—it reflects power relations and institutional priorities. Flint, like these other examples, shows that communities often must generate their own evidence to counter official claims. This connects directly to Environmental Data Justice (EDJ) and the CARE Principles, which emphasize transparency, accountability, and community sovereignty in data practices.
Solutions
Improved Testing Protocols
Protocols must require first draw samples from high risk homes, not pre flushed taps. Sampling should prioritize vulnerable neighborhoods and older housing stock to ensure representative coverage.
Bias Detection and Characterization
Agencies should use tools to detect and quantify bias, such as comparative sampling and critical appraisal frameworks (Konno et al., 2024). Independent audits and community science can validate official data.
Transparency and Communication of Uncertainty
All results—including “outliers”—should be published with clear explanations. Maps of sampling effort and contamination levels can show where data are strong and where gaps remain. Communicating uncertainty builds trust and allows communities to make informed choices.
Applicability to Other Cases
The lessons from Flint extend broadly:
- Suppression bias in climate data (Nost et al., 2024).
- Measurement bias in air monitoring (Walker et al., 2018).
- Deficit framing in Indigenous statistics (Walter & Suina, 2019).
- Sampling bias in biodiversity monitoring (Young et al., 2014).
In each case, improved sampling, bias detection, and transparent communication can mitigate distortions. Flint is one example of a broader pattern: environmental data often reflects institutional convenience or politics rather than community realities.
Conclusion
The Flint water crisis demonstrates how measurement and reporting biases can have life threatening consequences. Biased data can appear rigorous while systematically misrepresenting reality. Ensuring unbiased sampling, transparent reporting, and community participation is essential for trustworthy environmental science. Flint reminds us that data are not just technical observations, they are instruments of potential justice or injustice, depending on how they are collected and shared.
References
Hanna Attisha, M., LaChance, J., Sadler, R. C., & Champney Schnepp, A. (2016). Elevated blood lead levels in children associated with the Flint drinking water crisis: A spatial analysis of risk and public health response. American Journal of Public Health, 106(2), 283–290. https://doi.org/10.2105/AJPH.2015.303003
Konno, K., Gibbons, J., Lewis, R., & Pullin, A. S. (2024). Potential types of bias when estimating causal effects in environmental research and how to interpret them. Environmental Evidence, 13(1), 1–31. https://doi.org/10.1186/s13750-024-00324-7
Nost, E., Gehrke, G., Vera, L., & Hansen, S. (2024). Why the Environmental Data & Governance Initiative is archiving public environmental data. Patterns, 6(1), 101151. https://doi.org/10.1016/j.patter.2024.101151
Vera, L. A., Walker, D., Murphy, M., Mansfield, B., Siad, L. M., & Ogden, J. (2019). When data justice and environmental justice meet: Formulating a response to extractive logic through environmental data justice. Information, Communication & Society, 22(7), 1012–1028. https://doi.org/10.1080/1369118X.2019.1596293
Walter, M., & Suina, M. (2019). Indigenous data, indigenous methodologies and indigenous data sovereignty. International Journal of Social Research Methodology, 22(3), 233–243. https://doi.org/10.1080/13645579.2018.1531228